From Price Charts to Volatility Insights: Introducing Fetch Volatility History
Crypto markets are exciting, but they’re also unpredictable. Prices move in sharp swings, and for traders, those swings aren’t just noise; they’re the pulse of the market. To understand that pulse, you need more than price charts. You need volatility.
Volatility shows you how much an asset’s price has been moving around over a period of time. For options traders, portfolio managers, and even retail investors, having access to reliable volatility history is critical. It tells you how risky the market has been, how stable it might be, and when major shifts are underway. Until now, pulling this data together has been a challenge.
Messy APIs, incomplete records, and constant formatting issues forced traders to spend more time cleaning data than analyzing it. That’s where Crypto-Pandas steps in, turning complexity into clarity.
A New Endpoint Inside
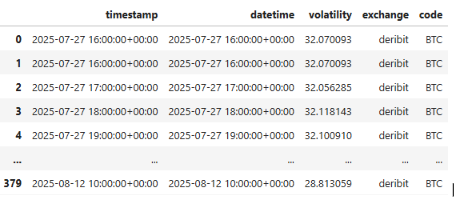
The latest addition to our CCXT-Pandas integration is the fetch_volatility_history endpoint. This feature unlocks a simple but powerful ability: fetching realized historical volatility directly from Bybit or Deribit
With just a few lines of Python, you can now look at the volatility of options tied to major symbols like BTC and ETH, without juggling multiple APIs or writing endless transformation scripts.
This isn’t just another data pull. It’s a structured, ready-to-use DataFrame that puts timestamped volatility data right at your fingertips.
How It Works
Here’s the code in action:
import plotly.express as px import ccxt from crypto_pandas_pro.extensions.ccxt_pandas_exchange import CCXTPandasExchange
From here, visualization is effortless. With tools like Plotly Express, Matplotlib, or Altair, you can plot clear charts that bring volatility patterns to life.
Why Historical Volatility Matters
Price movements on their own only show you where the market has gone. Volatility gives you the context behind those moves. By analyzing volatility history, traders can:
Identify risk windows – Spot periods when the market was particularly unstable.
Compare assets – See how BTC’s volatility stacks up against ETH over the same timeframe.
Refine strategies – Use volatility patterns to adjust options pricing models or hedge positions.
Anticipate market mood – Rising volatility often signals uncertainty or upcoming shifts.
For example, in August, we saw ETH volatility spike as prices swung between $1,200 and $1,080. With fetch_volatility_history, you can capture and analyze those moments in seconds.
A Cleaner Path to Insights
What sets this apart is the simplicity. Instead of patching together multiple sources, cleaning the mess, and hoping the numbers align, you now get clean, reliable volatility history straight from the exchange.
Crypto-Pandas-Pro combines CCXT’s wide exchange coverage with Pandas’ powerful data handling. That means your trading workflow is faster, more accurate, and far less frustrating. No extra steps. No wasted hours. Just a clear pipeline from raw data to insight.
No extra steps. No wasted hours. Just a clear pipeline from raw data to insight.
The Edge for Traders
Whether you’re a quant designing models, an options trader watching risk, or just someone exploring the dynamics of crypto markets, volatility history is a critical input. With this new endpoint, you can:
Backtest strategies with more realistic volatility assumptions
Build dashboards that monitor volatility trends in real-time
Add volatility overlays to price charts for deeper context
Enhance your understanding of how BTC and ETH options behave
It’s about giving you the data that actually matters, in a format that’s ready to use.
Crypto markets won’t stop being volatile, but now, you can measure and understand that volatility with precision. The new fetch_volatility_history endpoint makes it easy to go from raw exchange data to actionable insights in minutes.
Start using Crypto-Pandas-Pro today and see how volatility history can sharpen your trading edge.